Creating annotations around the tumor
Creating annotations for the central region, inner margin and outer margin
I’ve been asked more than once about making annotations for different areas around the tumor – most recently here and here.
Currently, it’s possible to use Objects → Expand annotations – but it’s a bit awkward, especially around tissue boundaries. And if you apply it after cell detection, QuPath may be very slow as it tries to resolve which objects are inside which annotations.
Therefore I’ve written a script (at the bottom of this page) that I hope helps for now. Based on the feedback and whether it seems to help, it might graduate to becoming a built-in QuPath command in the future.
Step-by-step guide
Find and open a suitable image. Or, in this case, the same one I depend on a lot for tutorials (as it’s part of the OpenSlide freely-distributable test data).
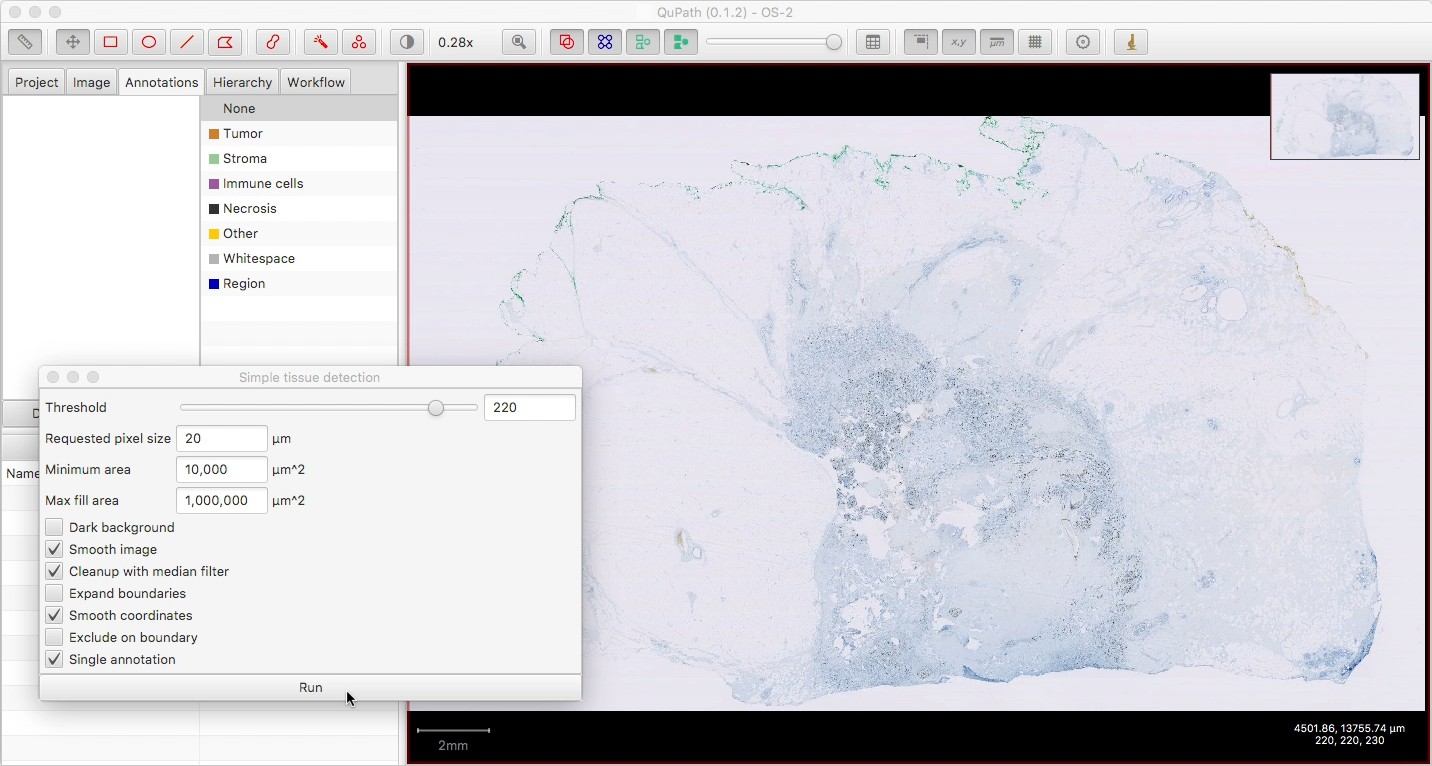
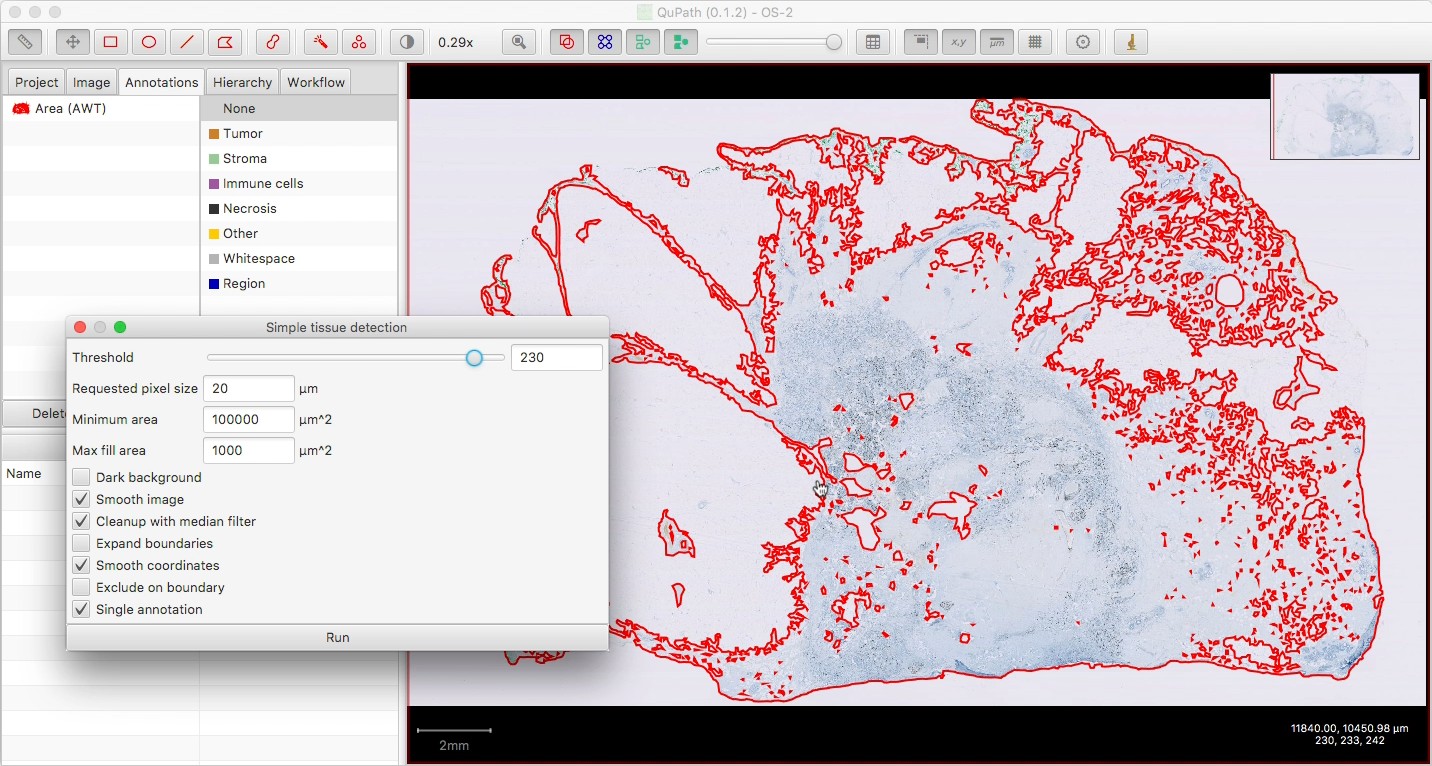
Create one single annotation for the main tissue region, either manually or with a command like Simple tissue detection (with ‘Single annotation’ selected).
This is optional: if present, then QuPath will constrain all the other annotations to fit inside this one. If absent, the annotations will be constrained only by the image size. If multiple additional annotations are present, the script will refuse to run.
Now annotate the main tumor region, however you wish to define it. You don’t have to be too careful about staying inside the tissue annotation, if you have one, since the results will be clipped to the tissue.
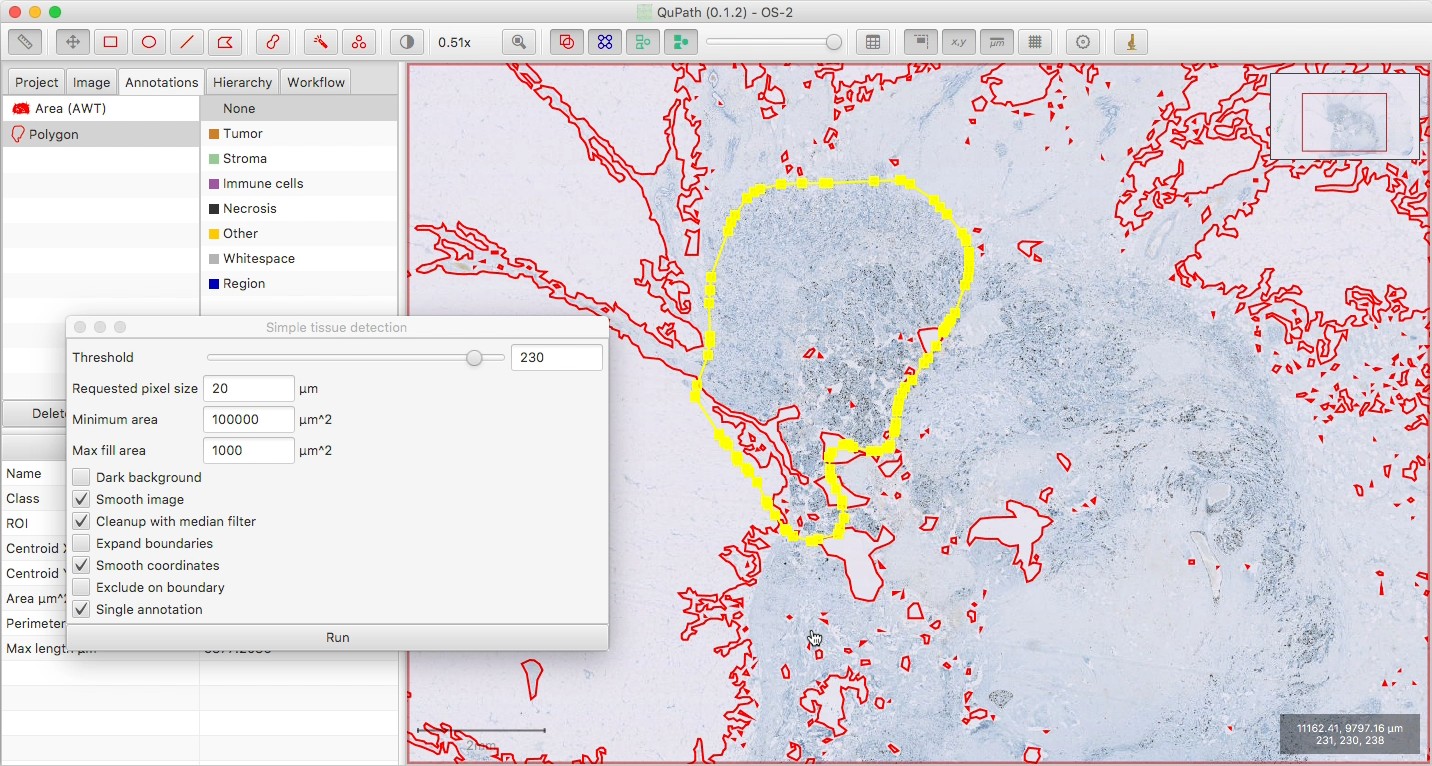
Make sure your tumor annotation is selected, then run the script below.
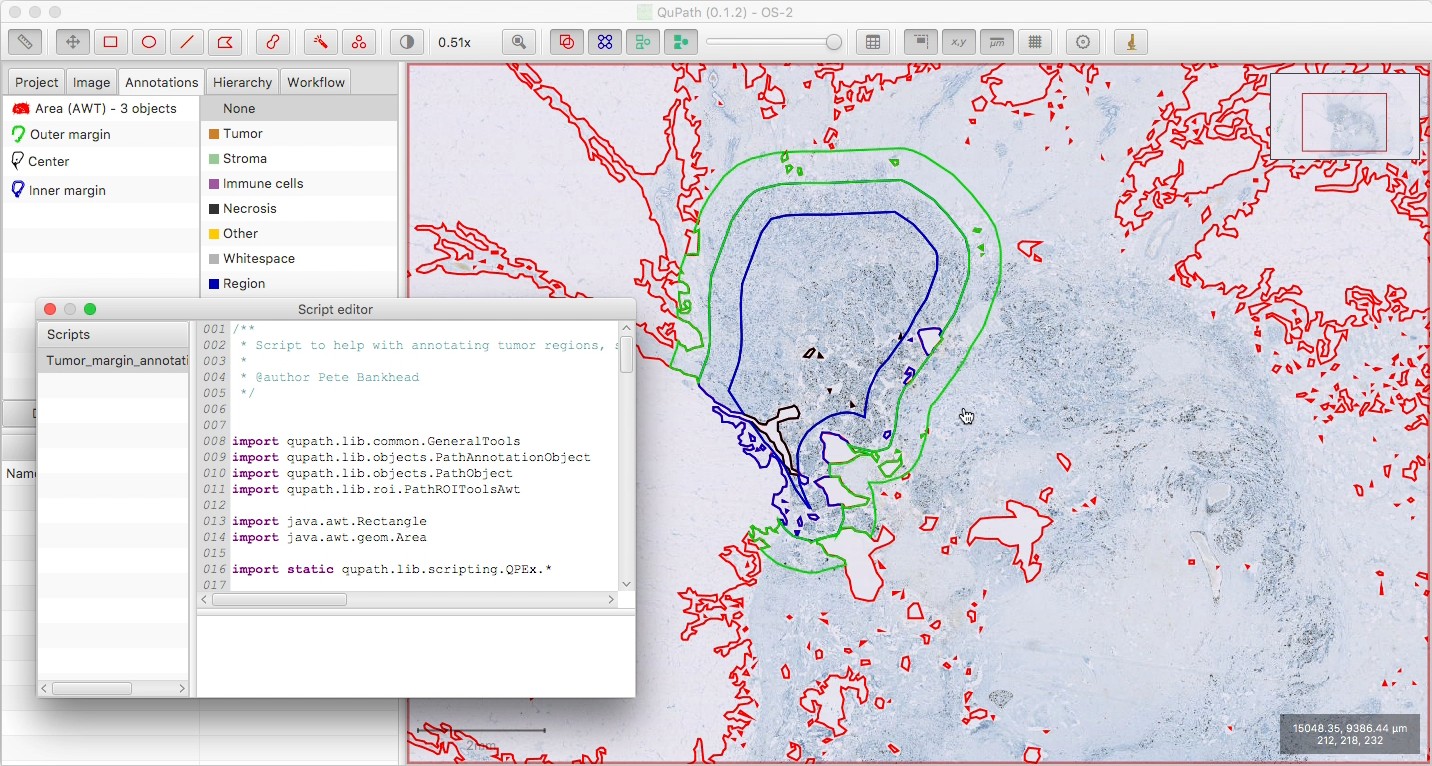
Using the original annotation, it will create an inner and an outer margin, approximately 500 µm in width, and the remainder as a ‘central’ region.
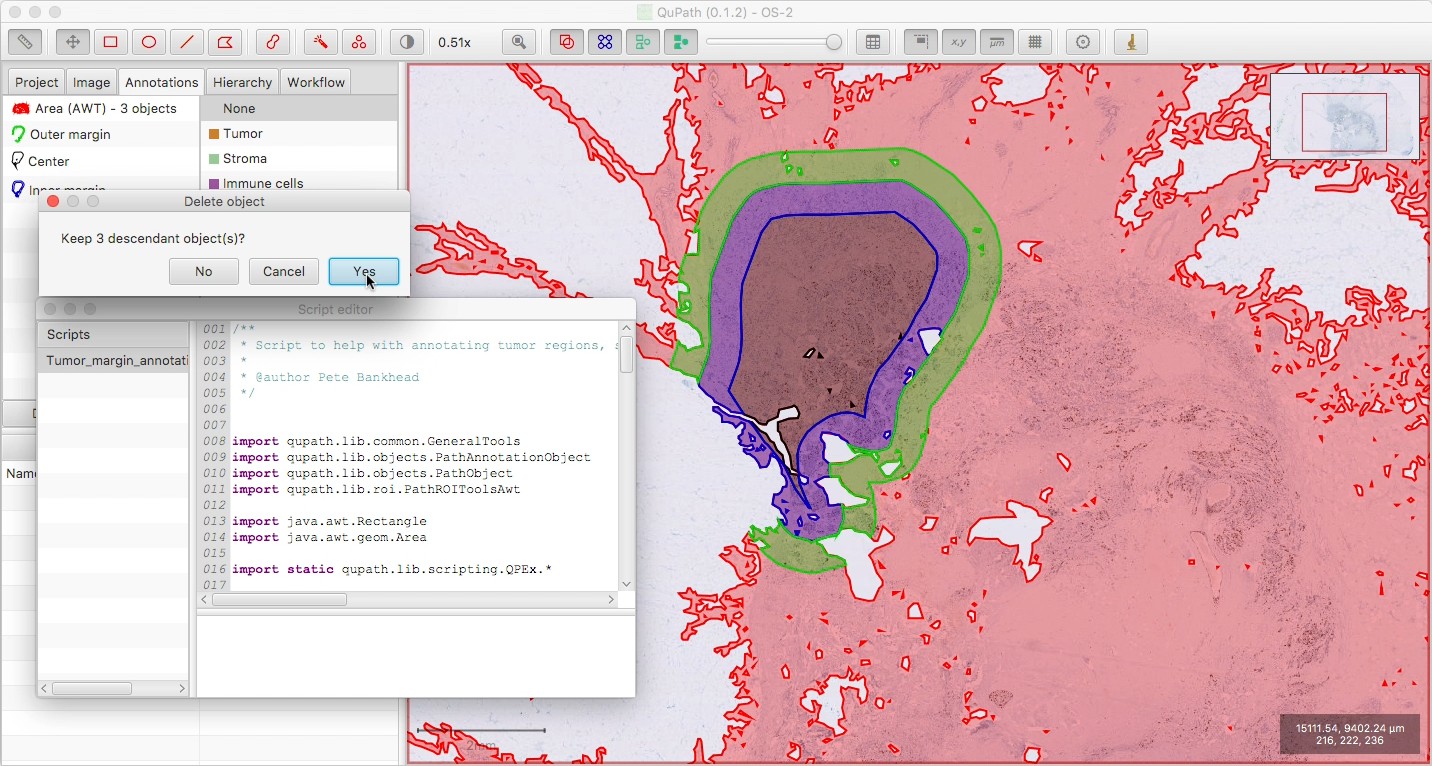
Optionally delete the tissue annotation, if you want; be sure to ‘Keep descendant objects’ if you do, to avoid deleting your three new annotations.
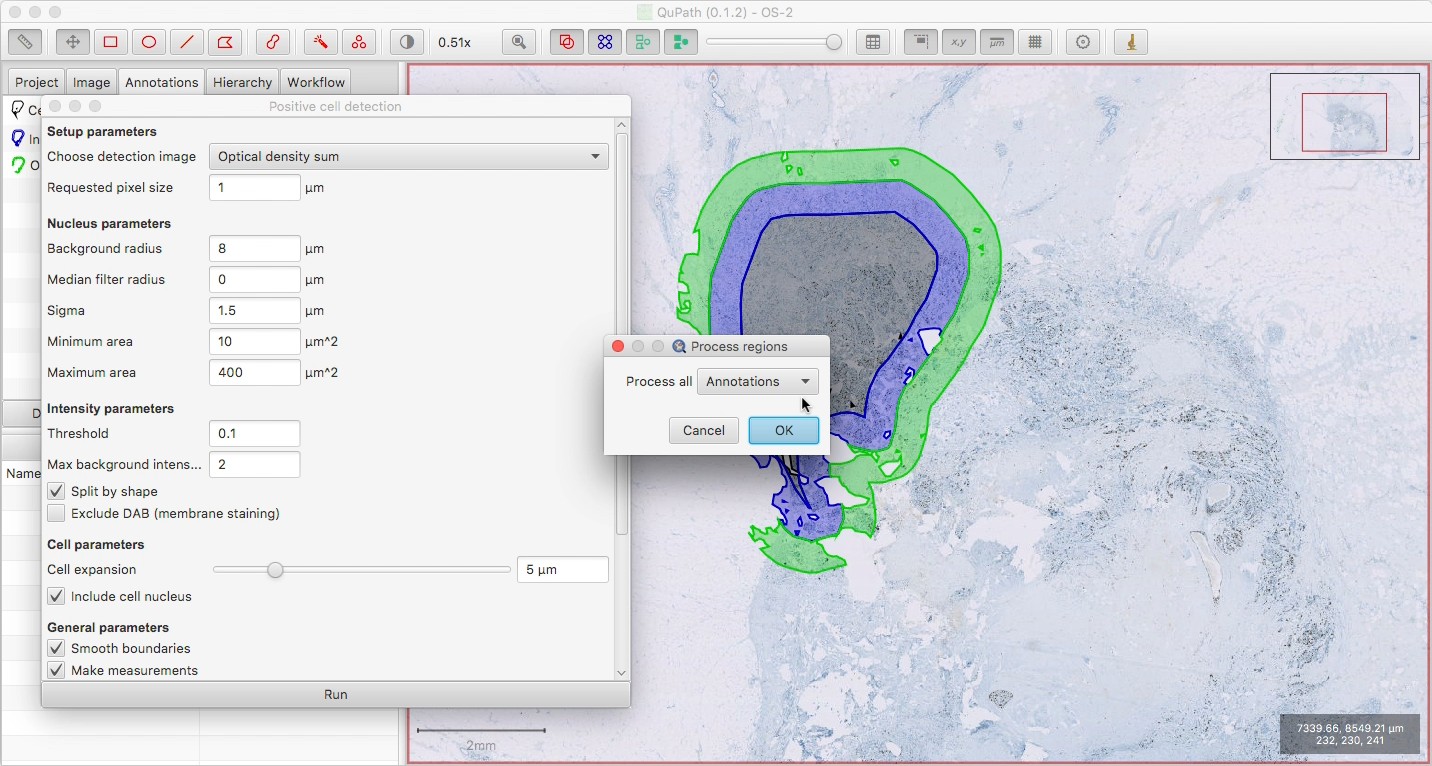
Run the Positive cell detection or whatever command you require. If nothing is selected, you can choose ‘Process all: Annotations’ to detect in all three regions.
This assumes that you don’t have a tissue annotation at this point; if you do, you wouldn’t want to select it, since it would clear everything else inside it first… thereby deleting your three annotations.
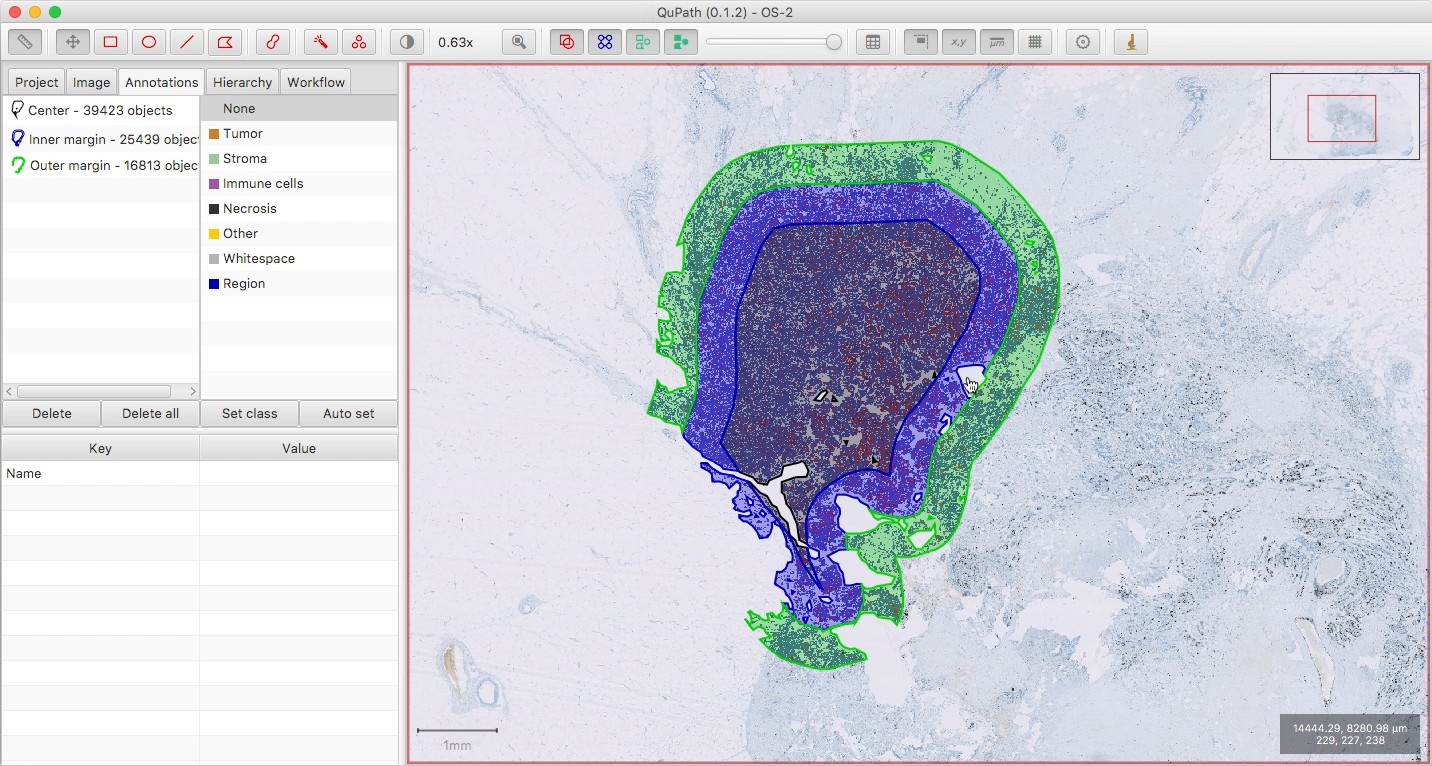
Check the results of the cell detection, to ensure all seems ok.
Note that the three regions are non-overlapping, i.e. the outer regions are essentially rings around the central part (and not three regions of decreasing size nested inside one another).
Shift + Fcan be used to show the annotations ‘filled in’, and make it easier to see what each contains.
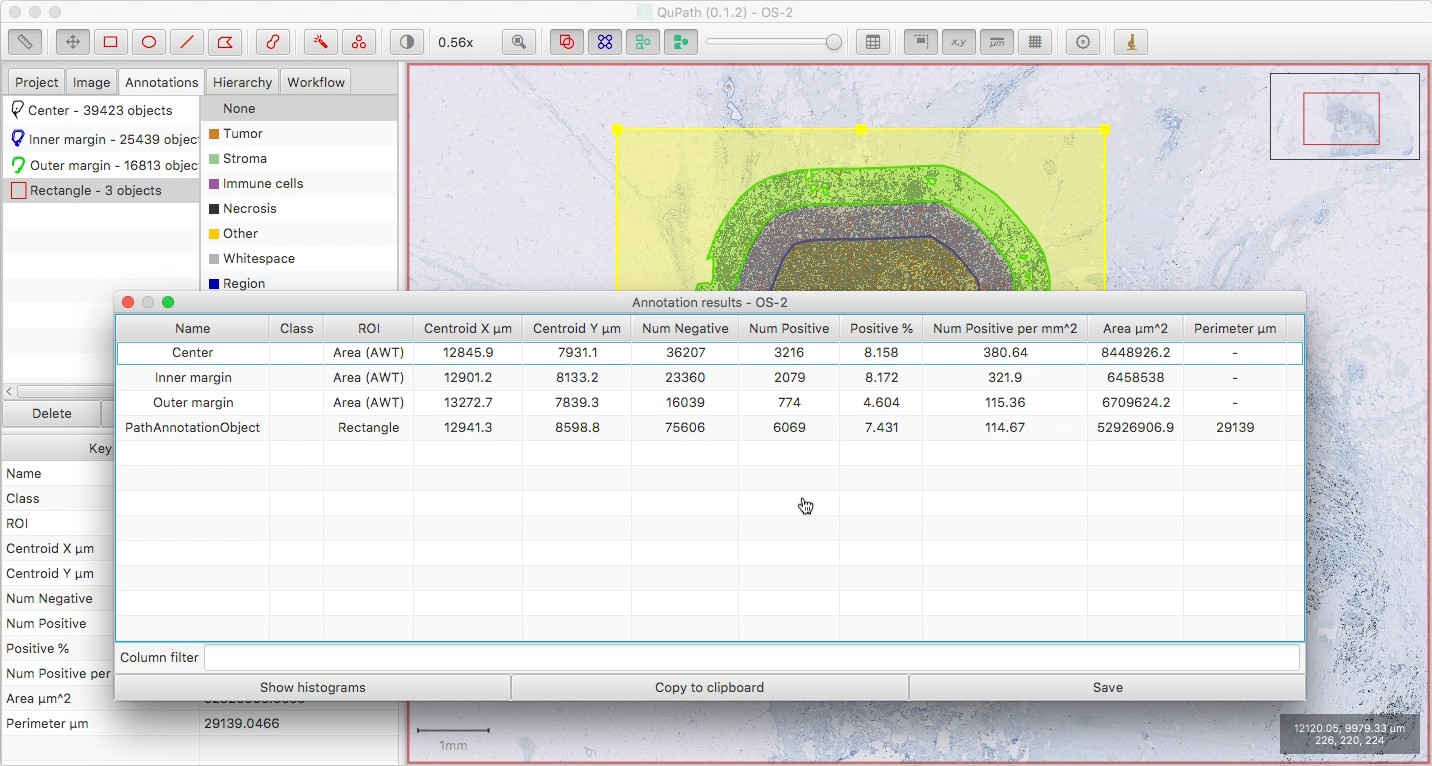
View the results with Measure → Show annotation measurements.
Here, I’ve also drawn a generous rectangle around everything, to get a combined count of all the cells within all the regions. Note that the ‘Num positive per mm^2’ for this outer rectangle will not be meaningful, since not all of its area is relevant.
The script
A few notes on the script:
- The default width of the ‘margin’ annotations is 500 µm; you can change this by adapting the line
double expandMarginMicrons = 500.0 - The script sets the name and color of the annotations - and not their classification. This is because we want the regions to be distinguishable, but if we are training a classifier for the cells inside that we don’t want their classifications to be used for training.
- Because each region is independent, there might be more ‘boundary artefacts’ at edges, or potentially cells split between regions.
As always: check everything to make sure it is doing both what it should and what you expect.
For example, if you’re skeptical about the margin width you can draw a straight line and use its length to help verify. And if you are subsequently using something like Add smoothed features but aren’t sure if it smooths across regions, use Measure → Show measurement maps to visually check.