Script of the Day: Whole slide image processing with ImageJ
Do real, customizable image processing with QuPath & ImageJ.
Grab regions, apply color deconvolution, detect & measure stained pixels, send results back.
The previous script looked at extracting image regions to ImageJ.
At that time we just showed the result. This script leaps forward to apply useful processing.
Highlights include:
- Send all or part of the whole slide image to ImageJ, specifying the resolution in a scanner and magnification-independent way
- Apply color deconvolution in ImageJ, using the stain vectors from QuPath
- Optionally create & show a multichannel image from the deconvolved stains
- Apply an automated threshold & create a ROI for one specified stain
- Send back the ROI to QuPath along with the measurements
This is just one moderately straightforward algorithm, but it illustrates the idea. Applying these tools creatively, and some knowledge of Groovy or Java, it’s possible to apply almost any image processing you might want to whole slide images.
Not necessarily easily - at least not at first. But later we will look at extending this to incorporate other dependencies, including OpenCV, that can help even more.
We will also see how to package up useful functionality into reusable extension libraries, turning QuPath into an extremely powerful platform to develop novel algorithms for whole slide image analysis - all while leaving as much scope as you want for creativity… but not yet.
Problem
Many ‘simple’ histology analyses involve digitally separating stains, then using a threshold to find stained regions.
Measurements can then be made - typically of area.
QuPath v0.1.2 has some relevant commands in this regard (Positive pixel count, Detect cytokeratin annotations), but they aren’t terribly good or flexible.
Better tools in this area are planned… but even these won’t handle all cases.
A really flexible approach is required that can be customized to solve any problem for which QuPath doesn’t already have a built-in command to do the job.
Solution
The integration of QuPath & ImageJ makes it possible to do a lot.
This builds on the last script to extract pixels from QuPath by adding in some non-trivial processing, and sending the results from ImageJ back to QuPath for visualization & further use in a whole slide context.
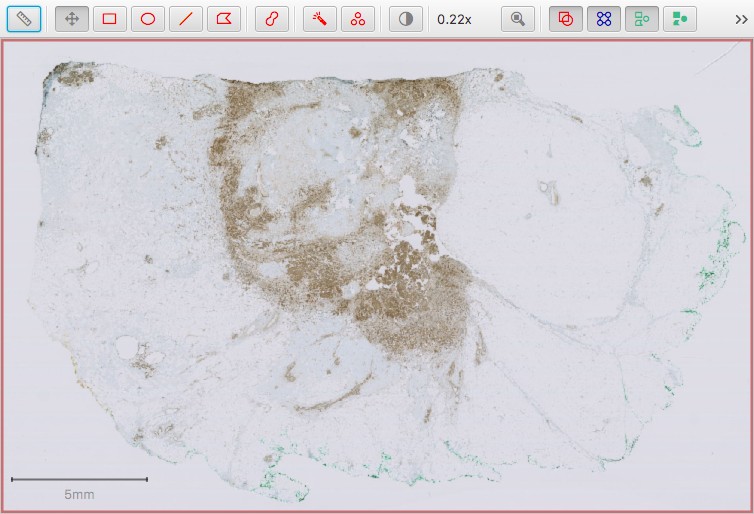
The example image below is OS-3.ndpi from the OpenSlide freely distributable test data: http://openslide.org.
OS-3.ndpi within QuPath
To begin, we define some variables that will be useful later.
It helps to add these at the top of the script, since it may well help to adjust them.
// Just view the image - don't do further processing
// This is useful to help interactively explore potential parameters and processing steps
boolean viewOnly = false

// Define the resolution of the image we want to work with
// A typical 'full-resolution, 40x' pixel size for a whole slide image is around 0.25 microns
// Therefore we will be requesting at a *much* lower resolution here
double requestedPixelSizeMicrons = 20

// The stain that should be thresholded
def stainName = 'DAB'
// Sigma value for a Gaussian filter, used to reduce noise before thresholding
double sigmaMicrons = 20
// Built-in automated threshold method used by ImageJ
def thresholdMethod = AutoThresholder.Method.Otsu
Now we request data structures related to the current image from QuPath:
// Access the relevant QuPath data structures
def imageData = QPEx.getCurrentImageData()
def hierarchy = imageData.getHierarchy()
def server = imageData.getServer()
The approach we are applying here is intended for brightfield images and uses color deconvolution. We need the image to be 8-bit RGB, so can add a quick check here - and give up early with a meaningful message if the image is unsuitable.
We also need a reference to the stain vectors defined within QuPath - which we can request easily from the ImageData.
// For color deconvolution, we need an 8-bit brightfield RGB image, and also stains to be set
// Check for these now, and return if we don't have what we need
def stains = imageData.getColorDeconvolutionStains()
if (!server.isRGB() || !imageData.isBrightfield() || stains == null) {
    println 'An 8-bit RGB brightfield image is required!'
    return
}
We should also check that the stain we will need to threshold is really present:
// Get the index of the stain we want, based on the specified name
int stainIndex = -1
for (int i = 0; i < 3; i++) {
    // Stains are accessed as 1, 2, 3 (and not 0, 1, 2... sorry...)
    if (stains.getStain(i+1).getName() == stainName) {
        stainIndex = i
        break
    }
}
if (stainIndex < 0) {
    println 'Could not find stain with name ' + stainName + '!'
    return
}
If the user has an annotation object selected, we can restrict our processing to that annotation. First we need to check if that is the case, and if so request the ROI for the annotation.
// If we have a selected annotation object with a ROI, use that - otherwise use the entire image
def selectedObject = hierarchy.getSelectionModel().getSelectedObject()
def selectedROI = selectedObject?.isAnnotation() ? selectedObject.getROI() : null
If the construct
a ? b : cis unfamiliar to you, see this Wikipedia description.The
?.syntax is part of Groovy, and is used here to avoid null pointer exceptions if there is no object selected.
We now create a RegionRequest, either corresponding to the selected annotation ROI (if available) or to the entire image.
// Convert requestedPixelSizeMicrons into a sensible downsample value
double downsample = requestedPixelSizeMicrons / server.getAveragedPixelSizeMicrons()

// Create a region request, either for the full image or the selected region
def region = selectedROI == null ?
        RegionRequest.createInstance(server.getPath(), downsample, 0, 0, server.getWidth(), server.getHeight()) :
        RegionRequest.createInstance(server.getPath(), downsample, selectedROI)
Request an ImageJ ImagePlus for the region.
Here, we also keep a reference to a PathImage wrapper, which is returned with the ImagePlus. We don’t need it, strictly speaking, but it will come in handy later for converting ROIs back from ImageJ to QuPath in a convenient way.
// Request a PathImage containing an ImagePlus
server = ImagePlusServerBuilder.ensureImagePlusWholeSlideServer(server)
def pathImage = server.readImagePlusRegion(region)
def imp = pathImage.getImage()
Now apply color deconvolution, using QuPath functions.
// Get the current ImageProcessor - it should be 8-bit RGB, so we can
// ask Groovy to make sure it's an ImageJ ColorProcessor, required for the next step
def ip = imp.getProcessor() as ColorProcessor

// Apply color deconvolution - this gives a list of 3 stain images
def fpDeconvolved = ColorDeconvolutionIJ.colorDeconvolve(ip, stains)
If we want to check how things are going, and what kinds of filters and thresholds we might need to get the result we want, it can help to show the original and deconvolved images in ImageJ. This allows us to explore them interactively while still refining the script.
This can be turned on/off by changing the viewOnly variable defined above.
// If we just want to view the images, show them as an ImageJ stack
if (viewOnly) {
    // Ensure the ImageJ user interface is showing
    IJExtension.getImageJInstance()
    // Show the original image
    imp.show()
    // Create an ImageStack for the stains, setting the labels according to stain names
    def stack = new ImageStack(imp.getWidth(), imp.getHeight())
    fpDeconvolved.eachWithIndex { FloatProcessor fpStain, int ind ->
        stack.addSlice(stains.getStain(ind+1).getName(), fpStain) // Note base-1 indexing for stains! Sorry again...
    }
    // Create a new image for the stains, setting the calibration based on the original image
    // This means we can use 'Send ROI to QuPath' if we want
    def impDeconvolved = new ImagePlus('Color deconvolved ' + imp.getTitle(), stack)
    impDeconvolved.setCalibration(imp.getCalibration().clone())
    // Make the image pseudo-fluorescence, with 3 channels & reset the brightness/contrast for display
    impDeconvolved = new CompositeImage(impDeconvolved, CompositeImage.COMPOSITE)
    impDeconvolved.resetDisplayRanges()
    // Show the image
    impDeconvolved.show()
    return
}
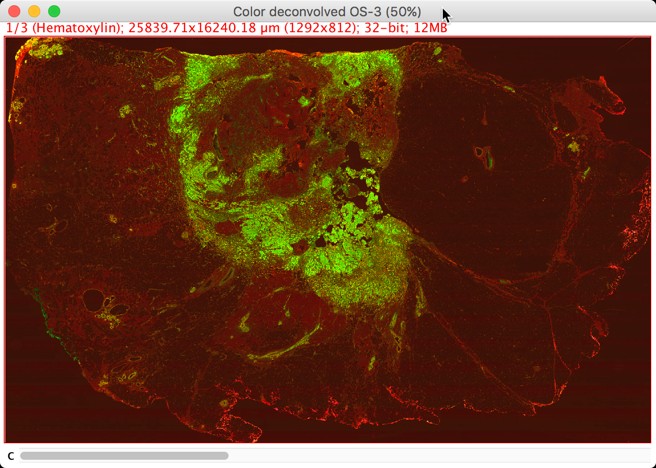
Visualization of deconvolved channels in ImageJ (with linear contrast adjustment)
Red is used for hematoxylin, green for DAB
We are now ready to extract the required stain image, smooth it, apply a threshold and create an ImageJ ROI for the thresholded region.
While we’re here, we may as well also make some measurements.
// Extract the stain ImageProcessor
def ipStain = fpDeconvolved[stainIndex]

// Convert blur sigma to pixels & apply if > 0
double sigmaPixels = sigmaMicrons / requestedPixelSizeMicrons
if (sigmaPixels > 0)
    ipStain.blurGaussian(sigmaPixels)

// Set the threshold
ipStain.setAutoThreshold(thresholdMethod, true)

// Create a selection; this will use the current threshold
def tts = new ThresholdToSelection()
def roiIJ = tts.convert(ipStain)

// Make some measurements
ipStain.setRoi(roiIJ)
def stats = ImageStatistics.getStatistics(ipStain,
        ImageStatistics.MEAN + ImageStatistics.MIN_MAX + ImageStatistics.AREA, imp.getCalibration())
We can convert the ImageJ ROI into a QuPath ROI, and use it to construct a new PathAnnotationObject, representing a new QuPath annotation.
This is where pathImage comes in handy - it packages up information needed to do the conversion, so it does not need to be recalculated.
// Convert ImageJ ROI to a QuPath ROI
// Here, the pathImage comes in handy because it has the calibration info we want
def roi = ROIConverterIJ.convertToPathROI(roiIJ, pathImage)

// Create a QuPath annotation
def annotation = new PathAnnotationObject(roi)
We can add the measurements we made to the measurement list of the annotation.
// Add the measurements to the annotation's MeasurementList
// While we're here, add the threshold value as a measurement too
// Warning!  This uses the *smoothed* stain image - it might be better to use the original!
def measurementList = annotation.getMeasurementList()
measurementList.putMeasurement('Threshold (IJ)', ipStain.getMinThreshold())
measurementList.putMeasurement('Area (IJ)', stats.area)
measurementList.putMeasurement('Mean ' + stainName + ' (IJ)', stats.mean)
measurementList.putMeasurement('Min ' + stainName + ' (IJ)', stats.min)
measurementList.putMeasurement('Max ' + stainName + ' (IJ)', stats.max)
// Once we're done adding measurements, it's important to close the list -
// this can allow QuPath to optimize the storage (very important if there are many objects)
measurementList.closeList()
Finally, we can add the annotation to the object hierarchy in QuPath:
// By default, lock the annotation to make it harder to accidentally edit
annotation.setLocked(true)

// Add the annotation back to the hierarchy
// If we have a parent object, we can tell QuPath to put it below that -
// if we leave it up to QuPath to figure out that relationship, it might put the object
// *beside* rather than within the intended parent, because of potential slight pixel shifts
// in the conversion to/from ImageJ meaning the new annotation is not fully contained inside the parent
if (selectedObject != null)
    imageData.getHierarchy().addPathObjectBelowParent(selectedObject, annotation, false, true)
else
    imageData.getHierarchy().addPathObject(annotation, false)
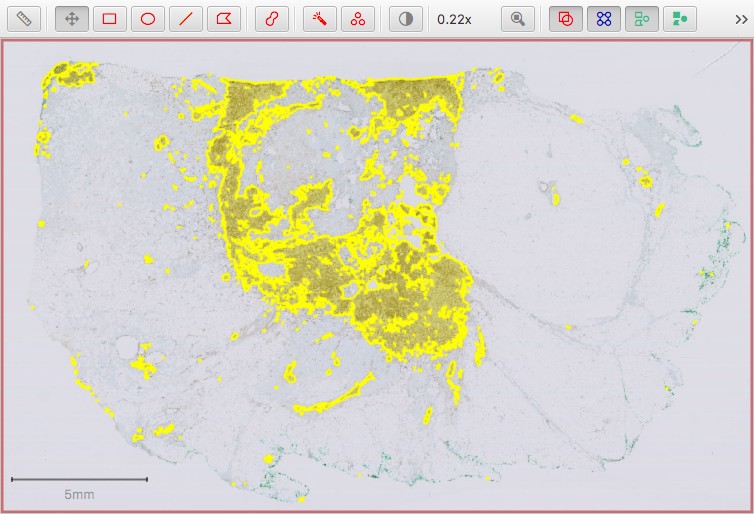
ImageJ ROI returned to QuPath as an annotation
Caveats & warnings
The purpose of this script is to show how technically to do image processing with QuPath by using ImageJ, and show some of the main steps involved.
The actual algorithm applied here is certainly open to criticism. Some elements I don’t particularly like myself:
- Automated thresholds are useful to reduce the bias of manual thresholding. However, most automated methods built-in to QuPath (including the one used here) assume that there will be something to detect. Applying such methods can work very well when that is the case, but in a completely negative image (with no DAB staining) could leave to completely wrong results - with a severe over-detection. So be careful!
- Intensity measurements of DAB should be treated extremely cautiously… if not ignored. They are included here to show the process of making and returning the measurement of intensity values in general, not because they are particularly useful.
- Intensity measurements are also quite questionable in general when applied to large regions that were themselves identified using intensity-based thresholds. For example, the threshold and ‘min’ value are likely to be identical. If the threshold were lower, the ‘min’ value would also be lower - and the mean dragged down too. Therefore these measurements are highly dependent upon the threshold chosen. The area depends on the threshold too.
- Intensity measurements here as based on the smoothed image… it may be preferable to apply them to the original (deconvolved) image (by applying color deconvolution again, or duplicating the original prior to smoothing).